|
|
 |
|
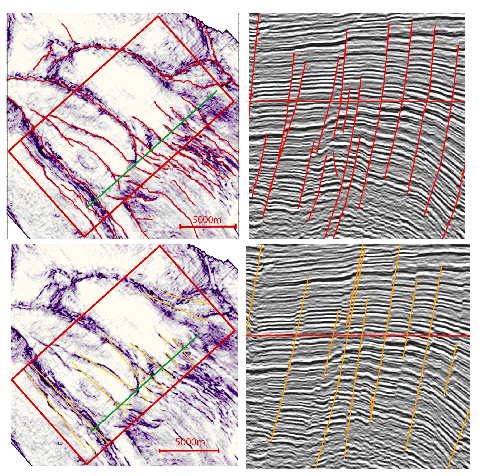
Typical results are shown below showing the detected surfaces overlaid onto slices of seismic data. Manually identified faults are shown for reasons of comparisson.

|
|
Figure: Horizontal slice through seismic coherency volume (left-hand images) and vertical slice through seismic dataset. They allow comparison of the traces of faults picked manually (shown in red), and by machine (gold).
|
Back
Next
|
|


